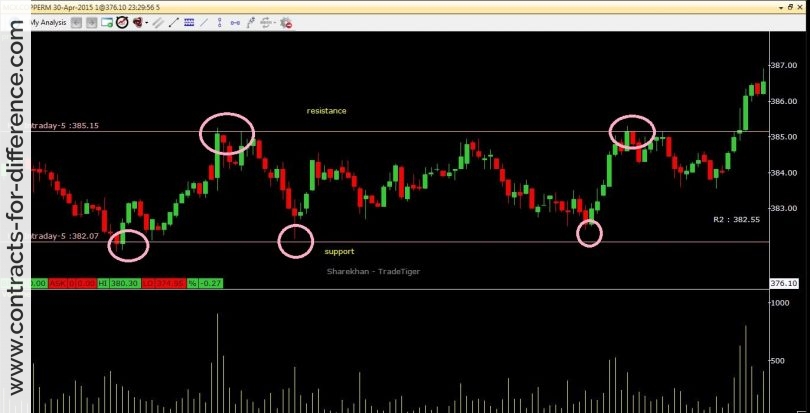
Perhaps because so many ways have been invented to technically analyze trading charts, the use of a simple pivot is often overlooked. It’s still an effective way of looking at support and resistance levels to identify a breakout from a stalled price range. You will find that the work is done for you on many charting packages.
The basic idea is that you draw a pivot line, and from this construct a couple of support levels and a couple of resistance levels. You are then able to identify any significant move that breaks out of the trading range. The daily pivot line is usually drawn from the average of the high, low and close prices of the previous day, although there are other variations.
The first line of resistance is calculated from this, by multiplying the pivot value by two and subtracting the low value of the pivot day. This puts the resistance as far above the pivot level as the low was below it. The calculation of the first line of support is based on exactly the same idea, but using the high value from the pivot day.
What you done is create what may be considered a normal range for the price, as it reflects what has been seen in the past. If the price is in an uptrend, the resistance level calculated in this way is considered to be the first level at which the price may turn back. When a downtrend is seen, confirmed by the price being below the pivot level, the first support line is similarly the level where you first look for a halt in the slide.
The second support and resistance levels are also easy to calculate. They are as far from the pivot line as the entire range of the pivot day, that is the high minus the low value, and therefore outside the first lines. If the price goes past the first lines, whether support or resistance, then the second line is looked at as the expected limit for the trading day.
By calculating the second support and resistance lines in this way, you are now identifying what may be considered the extreme levels for the price. The first lines give the normal range, the second the extremes. If the first is passed, the second is the target, and any break through the second line is considered a break out and significant.
The strategy for the pivot point trading is to sell your long position if the price finds resistance at either of the resistance levels, and cover a short position if the price finds a support at those levels. When you want to go long, don’t buy until the price has gone past the resistance levels, as it may not continue rising. The opposite applies to the support levels. If you are looking to take out a short position because of your analysis, you should avoid doing so any time the price is approaching one of the support levels, and wait to see if it finds support there.