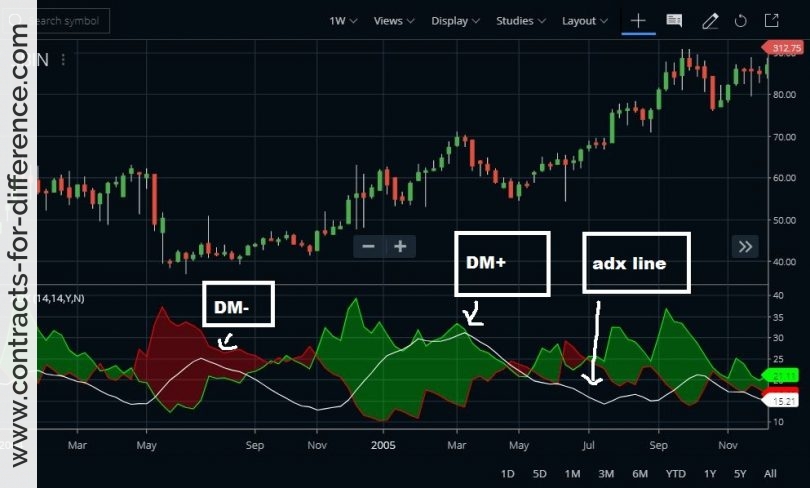
‘Technical Analysis for Dummies’ doesn’t even mention the Average Directional Movement Index (ADX). That’s a big mistake, as it’s an indicator that gives clear and sensitive signals about whether a stock is trending, and gives early and reliable reversal signals. The Average Directional Movement Index was another indicator developed by Welles Wilder, who invented the Relative Strength Index, and it shows the strength of the price movement.
The ADX does not indicate the direction of movement, so it needs other indications to determine this. It commonly appears with the Plus Directional Indicator (+DI) and the Minus Directional Indicator (-DI). These move in opposite directions. The basic signals with these two indicators are to buy long when the +DI rises above the –DI, and to close or sell short when the +DI drops below the –DI. These indicators measure the current period against the previous periods, and you stand the chance of being whipsawed and overtrading if you base your trading on these. As CFDs are a leveraged instrument, you want to avoid this as far as possible, as it may involve margin calls and perhaps being taken out of the position.
The ADX line provides some smoothing to these directional indicators. It records the difference between the +DI and the –DI with an exponential moving indicator, usually using a period of fourteen days or bars. As mentioned, it does not give any directional indication on its own, and in this respect is unlike most other indicators. What it does do is show whether there is a good trend. If the ADX is below 30, it shows that the market is trendless, and not suitable for trend trading. Once the ADX breaks above 30, it signals that there is a trend in place, and you could consider a trade, but it does not tell you whether to go long or short.
The trend direction can be determined from the movements of the +DI and –DI, or from some other indicator such as the MACD. If the +DI is heading upwards, that shows an uptrend, but if the –DI is rising, that’s an indication of a downtrend and possible shorting opportunity.
While you should use other indications to confirm the market and not base your trading solely on one indicator, if you are using these directional indicators as triggers for your trading, your strategy for them would be as follows. While the ADX is less than 30, do not enter a trade. If the +DI rises up and crosses the –DI, you would get ready to take a long trade, and wait for the ADX to break above 30 for the signal to do so. You would exit the trade if the ADX dropped back below 30, or with some other means such as a trailing stop. On the other hand, if the –DI rises to cross the +DI this indicates a shorting opportunity. Entering the trade when the ADX goes above 30 means that you have confirmed a trend is in place. Again, you can exit when the ADX falls or by some other means.


